
With more and more people turning to Instagram to view and discover new products, read testimonials, check reviews, and make purchases, businesses can capitalize on its vast user base to connect with more customers around the globe. The platform has grown from just a photo-sharing platform to a community of buyers and sellers. Read this article to learn the latest stats about Instagram’s user demographics, features, and advertising potential, and use these facts to boost your own business’s success.
When Instagram was launched back in October 2010, little did any of us know that it would become one of the most used social media platforms 15 years later. Over time, the platform has undergone many changes, and the opportunities it offers today could not have been imagined before.
But using this platform is not as simple as uploading images, writing a caption, and hitting ‘Post’. Constant algorithmic changes, changing audience preferences, and new feature roll-outs make it difficult to keep up and understand the best ways to engage with the platform and get results.
So, what’s the best way to use Instagram as a marketer? How does one stand out from the crowd? We’ve curated some recent statistics that will give you a lowdown on this social media platform so you can ace Instagram marketing.
Introduction to Instagram Statistics
Instagram needs no introduction, but for the unversed (who refrain from joining social media), it is a leading photo-sharing platform that has recently grown into a short-video content sharing platform.
These days, Instagram, or Gram (as it’s lovingly dubbed by the younger audiences), does not just attract those interested in photo-sharing; it has become the marketing hub for brands wanting to increase brand awareness and gain more customers.
It doesn’t matter what size your brand is or what industry you belong to; this social media platform caters to all businesses looking to build or strengthen their online presence. So, whether you are selling shoes or running a pet daycare center, Instagram is the platform to build your online profile.
General Instagram Statistics
Before we drill down into Instagram’s user demographics and feature-related facts and figures, let’s quickly review some general stats to see how successful the platform is.
Instagram receives heavy traffic, with over 2 billion monthly active users (MAU). With this awe-inspiring MAU number, the social media platform comes third in rank after Facebook (3.07 billion users) and YouTube (2.53 billion users). For businesses, this means an opportunity to connect with and sell to more customers because 36% of users use Instagram to search for products.
An average user spends about 8 minutes and 38 seconds per visit, which indicates that people are viewing more content on Instagram than they are on Google.
To give you a better idea of how more and more people have been influenced by this platform, here is data showing the MAU growth through the years:
- December 2010: 1 million users (just 67 days after the launch)
- December 2011: 10 million users
- December 2012: 30 million users
- February 2013: 100 million users
- June 2016: 500 million users
- June 2018: 1 billion users
- October 2022: 2 billion users
As you may see, it took over 11 years for the platform to reach 2 billion users. Research online indicates that roughly 700 million users join each year. It’s no wonder if you look at its Google search volume, which stands at 7,247,352,866+, making Instagram the fourth most searched site in the world!
User Demographics
So, we know that Instagram is most popular with younger generations (millennials and Gen Z), but people aged 55 and above (approximately 7.5% of users) also use the platform. 32.2% of users are 35 years or older, and a whopping 60% of users are those aged under 35!
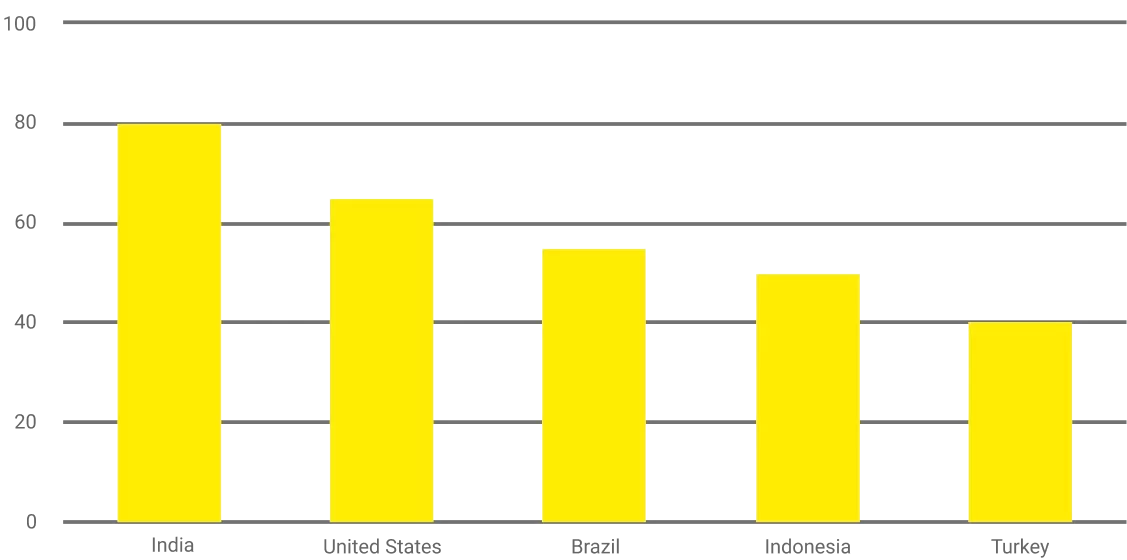
Let’s look at the top five countries that have the most users:
- India takes the largest share, with 362.9 million users.
- The US comes second with 169.6 million users.
- Brazil ranks third with a total of 134.6 million users.
- Indonesia occupies the fourth position with 100.9 million users.
- Turkey, at fifth position, has about 57.1 million users.
These numbers confirm the platform has a massive global reach, and many people prefer to spend a large amount of their time scrolling through their Instagram feeds.
In the United States alone, there are 171.7 million active users, which makes up 14.6% of the Instagram user base. Of this, 76% of users are aged 18-24, followed by 57% of those aged 25-30.
Instagram User Statistics
Having reviewed user demographic figures above, it’s evident that Instagram is a major social media platform that not only connects people but also offers a space for personal connections to thrive. Now, as a business, think about leveraging this power to put your products front and center on a global scale and drive sales like never before! With 50% of Americans using the platform and spending 16 minutes on it, it’s easier than ever to sell to US customers.
If we delve deeper and examine the gender ratio of user demographics, Instagram’s user base shows a nearly even distribution. Globally, 47.3% of users aged 18 and older are female, while 52.5% are male. In the United States, 55.4% of users are female, and 44.6% are male.
As of May 2026, the biggest group of Instagram users in the U.S., about 28.3 percent, was between 25 and 34 years old. The second largest group comprised those aged 18 to 24, who made up 26.5 percent of users. After that, 19.4 percent of users were aged 35 to 44. The smallest group was people over 65, who made up only 5.8 percent of users.
This means that the individuals spending most of their time on the platform are young adults who may be viewing entertaining content, product ads, chatting with others, and simply idly scrolling through their feeds.
Instagram Usage Statistics
Instagram is no longer just a platform for entertaining people. People have moved beyond idle scrolling, watching reels, and viewing stories to connect with their favorite brands and shop.
With video posts getting 49% more engagement than images and videos receiving 8 seconds of watch time, brands, big and small, can capitalize on users’ video-viewing appetite to showcase their products through Reels and Stories. They also form partnerships with influencers to market their products to the influencers’ followers.
According to Hootsuite, 86% of Instagram users in the U.S. use the platform for entertainment. More than reading news, they use the platform to stay connected with friends and family and watch fun content that brightens their day. But they also use it to discover new products and brands, read reviews and recommendations, and make purchases.
Instagram Content Statistics
As a marketer or business owner, knowing what to post and when to post it can help you appear in the feeds of your target audience just when you need to. According to Sociallyin, on average, 1.3 billion images are shared on the platform daily. If you don’t take a strategic approach to posting your content, you might not get the engagement you seek.
Simply using pleasing visuals and posting Reels and Stories at any time is not enough; you need to understand what will make your target audience stop scrolling and actually look at what you post. If they like what they see, they may even end up double-tapping and sharing the content with a friend.
Recent data reveals that carousels get 22.73% higher engagement than photos and videos. This type of content also makes up 17.27% of all Instagram content, demonstrably driving most interactions. For businesses, carousels are the most effective tool to display their products or disseminate information about their services. Videos can also be effective, given their broad reach (49% more than photos), for brands that invest more in video marketing.
50% of Instagram users use entertaining content, and about 41% expect to watch informative content. So, although your focus is on showcasing your offerings, invest some time and effort in creating infotainment content to ramp up engagement and broaden your brand appeal.
Instagram Stories Statistics
Brand marketing thrives on short-form video content, and this is where Instagram’s popular Stories feature can pack a punch. Stories can be anywhere from 15 to 60 seconds long, but since they disappear from everyone’s feeds after 24 hours, it’s important to post these strategically.
Stories attract over 500 million users daily and are a popular Instagram content format with millennials and Gen Z. Using Stories to post your brand content can easily give your engagement metrics a boost.
You may use hashtags to reach more people, but remember, a strong caption can spark engagement. Research shows that if a caption has more than 300 characters, you can expect 70% more comments. 50% of companies worldwide produce one story every month to increase brand recognition and engagement. This makes sense, especially as 62% of users say they become interested in brands after seeing them in Instagram Stories.
Instagram Reels Statistics
Just like Stories, Instagram Reels are known to drive audience engagement. Depending on a page’s follower count, the engagement rate can be between 6.59% and 8.77%. For business accounts, the average Reels engagement rate is 1.27%.
Since Reels also tend to be short and more attention-grabbing, 90% of users view them regularly and with more interest than static posts. Between 2023 and 2024, there was even a 12% increase in the use of this feature by brands reported.
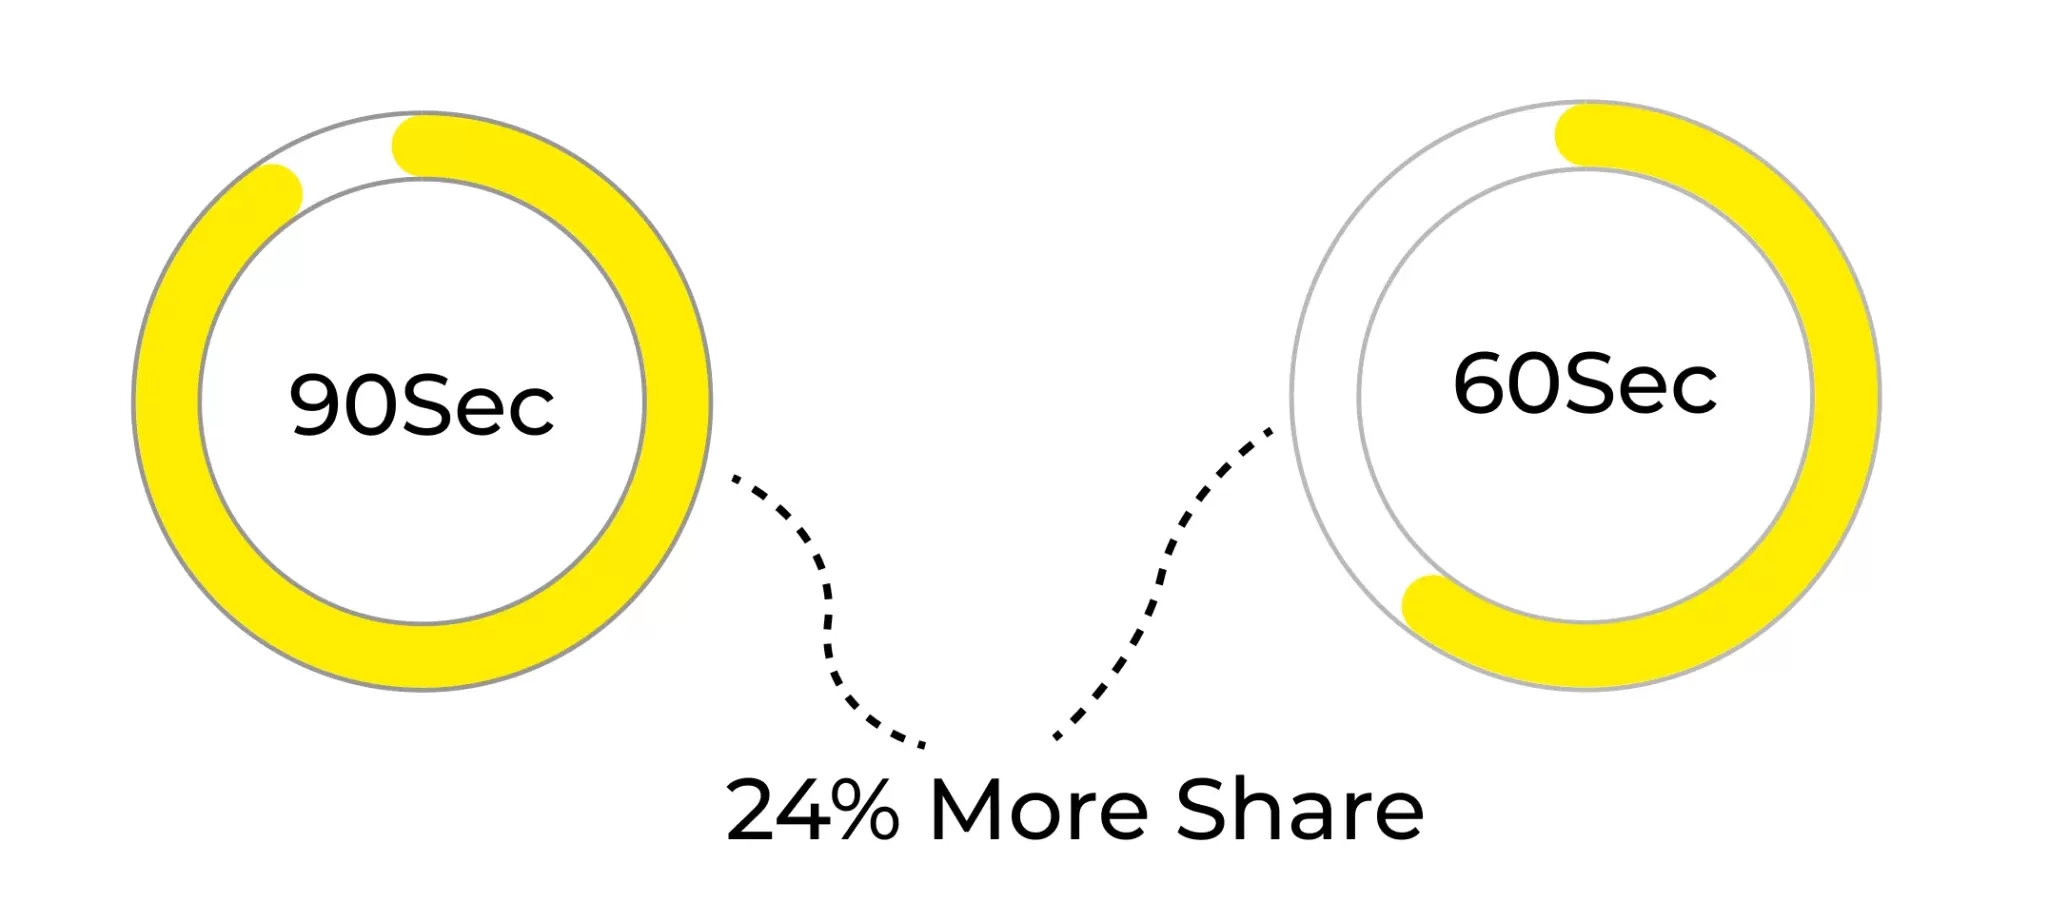
Reels that are 60 or 90 seconds long can get you 24% more shares. Many beauty brands use Reels (44% of their content is in this format) to showcase their products. Not just beauty brands; creators also tend to create more Reels (59% of content).
This trend rides high on the success of this video content type in driving engagement. Reels appear on the ‘Explore’ tab and are easily discoverable compared to other content types. They are also ‘reshared’ more than 4.5 billion times a day!
Instagram Advertising Statistics

Instagram advertising can deliver millions in revenue because it is a visual platform known for driving engagement and building brand recognition.
Instagram Ads reach over 96% of monthly active users. Because of this impressive reach, 46.7% of marketers use this medium. When it comes to users, a whopping 90% of Instagrammers follow at least one business account, and 61% rely on these ads to discover new products.
The platform is expected to generate $32.03 billion in US ad revenue in 2026, which is 24.4% higher than in 2024. Because of this, many brands are looking for more ways to connect with, engage, and convert their target audience.
While all types of content do well, Stories mostly outperform others. The average ad revenue per user is over $50, but multiply that by 849.3 million social media users. That’s how many people your brand can reach with compelling content delivered through this platform!
But brands have reported a higher Ad ROI when they partnered with influencers. Influencers have 1,000-100,000 followers and promote brands through their content. The average click-through rate for Instagram ads is 0.94% and the engagement rate is 1.08%, which means that users don’t just view but also interact with these ads.
Instagram Shopping and E-Commerce Statistics
The previous section paints a clear picture of how powerful Instagram can be for advertising. Brands that know how best to leverage the platform can expect a remarkable ROI on their ad spend.
But the platform can help you do more than advertising; it supports sales, too. So, if you are familiar with users’ browsing and shopping habits, you can be sure to drive some sales in addition to engagement.
Shopping is a feature on Instagram that was rolled out in 2018. You can say that it was a turning point because the feature bridged the gap between engagement and organic sales, allowing businesses to tap into ecommerce opportunities on the platform.
Many people turn to Instagram to shop online. Every month, 130 million users tap on ads and other shopping content on the platform. Now, so many people can’t just browse casually. This number clearly indicates that a vast majority of users also interact with the content, some of them making a purchase!
A survey conducted in 2023 supports this trend, showing that over 58% of US shoppers had bought a product after seeing it on social media. Given Instagram’s photo- and video-sharing platform, it can be considered a key contributor to this trend.
Posts can also be turned into ‘shoppable posts,’ which offer a seamless path from discovering a product to buying it. For brands, this is a smart strategy as shoppers can buy products without leaving the platform. Just think about it: Why will something that’s easily shoppable be an instant hit with the customers?
Instagram Shopping allows brands to encourage more sales by using product tags, shopping stickers, and the Shop tab—add-on features that help improve conversion and revenue growth.
Here are some more statistics to further illustrate why brands should have a solid Instagram selling strategy:
- 44% of people in the U.S. use Instagram to check out product reviews. (That’s a lot!)
- 40.1% of Instagram shoppers spend over $200 every year to buy products they find on the platform.
And guess what? This year, 37.3% of U.S. Instagram users are expected to shop products directly on the app!
Instagram Influencer Statistics

It’s impossible to not talk about influencer marketing when a full-fledged Instagram marketing discussion is underway!
These days, everyone’s Instagram feed is overrun with Reels and photo posts from several creators who may or may not be considered influencers. Influencers are content creators with large followings (1000-100,000 followers) who have earned trust and support from their followers. Some may even specialize in certain fields and bring more than just engaged followers to the brand marketing table.
The global influencer marketing market stood at roughly $10 billion in 2020, but has since grown three times this size. Instagram influencer marketing generated $13.8 billion in revenue, but this value is expected to be almost double this year.
With this data demonstrating a promising trend, brands are convinced that influencer campaigns are the most effective way to grow their awareness on Instagram. In fact, 57% of brands consider Instagram their preferred social media platform for influencer campaigns.
When choosing influencers for your brand, think about the engagement levels of different influencer account types. Nano influencers, who make up the vast majority of the influencer community (76.86%), have around 1000-10000 followers and the highest engagement rates at 2.19%. Microinfluencers, on the other hand, boast around 10000-100000 followers but get the least engagement (0.88-0.87%).
The top categories for influencer content are lifestyle, fashion, beauty, and food. If your business operates in any of these categories, chances are you’ll find many influencers willing to promote your business. 44% of influencers collaborate with brands they relate to and create meaningful content for their followers, as they realize that being authentic can only help them deliver value to the audience.
On average, businesses earn $6.50 for every $1 they spend on influencer marketing. Most companies find influencer marketing effective, and among brands that use influencer marketing to promote themselves, 57.6% operate as eCommerce stores. Plus, 51% of marketers believe that influencer marketing helps them generate quality leads who convert easily into customers, and 36% think influencer-generated content outperforms branded posts.
Conclusion
In this post, we delved into very specific details about Instagram’s features, evolving usage and engagement trends, shifting user behaviors, and business advertising options to see that a lot is happening on the platform.
These stats are packed with valuable insights that can inform any marketer’s Instagram advertising and selling strategies, helping them create targeted content to drive meaningful engagement and close more sales.
Understanding what content formats resonate with users the most, what advertising mediums will deliver the best results, and when to post your content can help you get the most out of your Instagram strategy. For instance, if you post a story about your recent launch in the middle of the night, you might not get the kind of engagement you expect. But if you do it in the early morning hours, more people are likely to see the story.
User engagement can vary across days of the week. To give you a fair idea of when you should aim to post your Instagram content, here’s a list of the recommended posting times:
- Monday: Between 11:00 am and 2:00 pm
- Tuesday: Between 10:00 am and 1:00 pm
- Wednesday: Between 10:00 am and 1:00 pm
- Thursday: Between 9:00 and 11:00 am
- Friday: Between 10:00 am and 11:00 am
- Saturday: Between 10:00 am and 11:00 am
- Sunday: Between 10:00 am and 11:00 am
Take this as a general guide and use Instagram’s Insights tool to track specific engagement patterns in your country or across regions. Find out which time zones most of your followers/target customers are in and then work out a posting schedule based on the chart shared above to get the most engagement.