Average Units per Transaction in E-Commerce: Stats & Insights 2025
Explore 2025 Average Units per Transaction (UPT) benchmarks, industry trends, and actionable strategies to improve sales, enhance customer value, and grow e-commerce revenue.
 Call Us
+1 857-847-3152
Call Us
+1 857-847-3152
Call Us
+1 857-847-3152
Call Us
+1 857-847-3152
Explore 2025 Average Units per Transaction (UPT) benchmarks, industry trends, and actionable strategies to improve sales, enhance customer value, and grow e-commerce revenue.

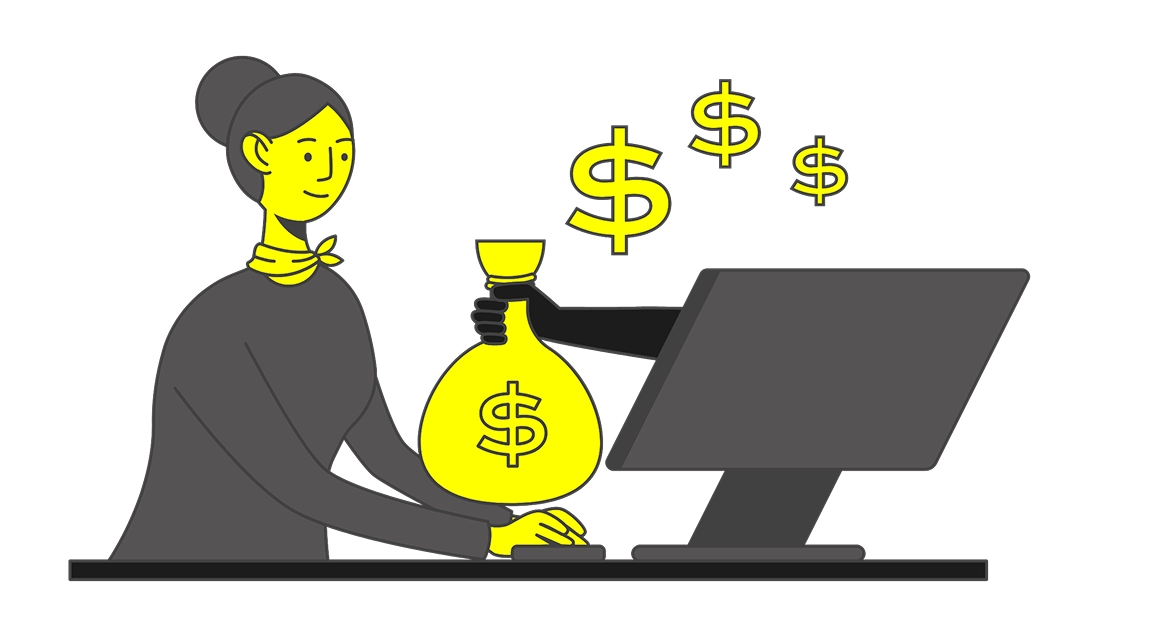
Understanding customer purchasing behavior is a necessity in the present-day digital and e-commerce landscape. One of the most revealing yet underutilized metrics in this field is Average Units Per Transaction (UPT). UPT doesn’t just show how many items shoppers buy per order. It is actually a powerful indicator of customer intent, product strategy effectiveness, and the overall health of your online store.
As digital storefronts increasingly encounter rising customer acquisition costs and shrinking attention spans, maximizing the value of each transaction becomes essential. That’s where UPT comes in. Whether you’re running a DTC beauty brand, a pet supply subscription business, or a high-ticket electronics store, knowing your UPT and how it stacks up across industries can help you discover new avenues for increasing average order value (AOV), optimizing promotions, and driving sustainable growth.
In this detailed study, we’ll explore the latest UPT benchmarks by industry for 2025, dive into the key business drivers behind unit volume, and offer data-backed strategies to increase your UPT in the year ahead. Backed by real-world examples and average units per transaction in e-commerce statistics, this guide is your comprehensive blueprint for understanding and improving one of the most impactful metrics in e-commerce.
looking at global ecommerce stats alongside upt benchmarks gives brands a clearer picture of industry performance and opportunities to maximize growth.

Average Units Per Transaction (UPT) is a critical metric in e‑commerce analytics:
UPT = Total Number of Items Sold ÷ Total Number of Transactions
It measures how many individual items, on average, a customer adds to their cart and purchases in a single e‑commerce order. UPT is a metric that effectively reveals shopper behavior and buying patterns, making it valuable for strategic decisions.
comparing upt with the average ecommerce conversion rate provides a fuller view of customer behavior, helping brands align sales strategies with real shopping patterns.
As already underlined, Units Per Transaction (UPT) is a critical performance metric for e-commerce businesses that measures the average number of items sold per customer transaction. As opposed to total sales or average order value, UPT provides nuanced insights into customer purchasing behavior and the effectiveness of merchandising strategies. In a highly competitive online retail environment, optimizing UPT can significantly influence revenue, profitability, and strategic agility. Below, we explore why UPT deserves close attention in any data-driven e-commerce growth strategy.
understanding upt is the first step in learning how to optimize ecommerce product performance, ensuring that every transaction drives greater value.
Increasing Average Units Per Transaction directly correlates with higher revenue without necessarily increasing the number of customers or the cost of customer acquisition. When shoppers add more items per order, businesses can leverage cross-selling and upselling techniques more effectively, turning casual browsers into bigger spenders. For example, offering bundle deals or “frequently bought together” recommendations encourages customers to increase their cart size, boosting total sales and creating new revenue opportunities with minimal additional marketing expense.
UPT optimization not only impacts top-line revenue but also enhances profit margins. Selling more units per transaction often lowers fulfillment and transaction costs on a per-item basis, as shipping fees and payment processing expenses are distributed across multiple items. Simultaneously, businesses can promote higher-margin products alongside popular items, pushing customers toward more profitable purchases. With thoughtful product assortment and promotion strategies based on UPT data, companies can drive more efficient sales that improve the overall profitability of each transaction.
UPT provides invaluable insight into customer preferences and shopping habits. Through an in-depth analysis of which products are commonly purchased together and how many items customers typically buy, retailers can identify patterns that inform merchandising and inventory decisions.
For example, a high UPT in a category might indicate customer demand for complementary products or multi-item purchases, which can guide targeted marketing campaigns. Understanding UPT trends helps businesses refine their offers, enhance personalization, and, as a result, create shopping experiences that resonate with their audience.
Data on UPT is essential for informed strategic planning in e-commerce. It equips decision-makers with the knowledge to tailor pricing models, promotional calendars, and inventory management to maximize transaction value. For instance, knowing peak UPT periods or the impact of specific campaigns on average unit sales can help optimize resource allocation and forecast future growth. Further, benchmarking UPT against industry standards allows businesses to set realistic goals and continuously devise strategies to maintain a competitive advantage in the fast-growing marketplace.

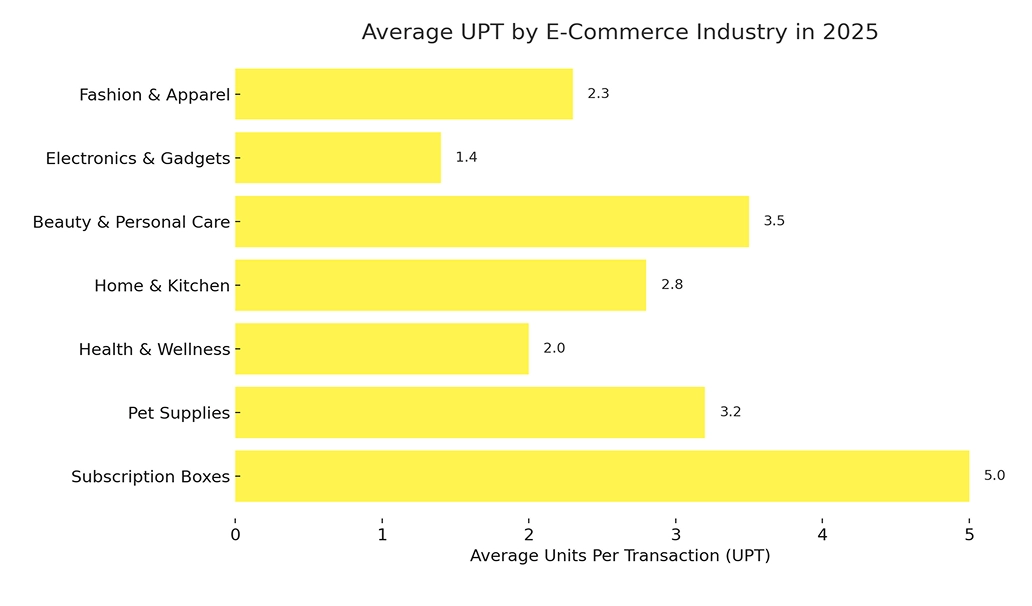
Understanding how Average Units Per Transaction (UPT) varies across industries gives e-commerce businesses vital benchmarks. It helps set realistic expectations and tailor strategies to industry-specific customer behavior. Below, we explore the 2025 UPT landscape across key sectors, drawing on recent data from leading market research firms and e-commerce analytics platforms.
Fashion and apparel continue to see moderate UPT levels, averaging around 2.3 units per transaction in 2025. This reflects consumers typically buying multiple pieces per order, such as coordinating tops and bottoms or several accessories. According to a 2024 report by Statista, seasonal trends and discount events like Black Friday tend to spike UPT temporarily, with some retailers reporting a rise to 3.0 units per transaction during peak sales periods. Online fashion stores also benefit from bundling offers (e.g., buy two, get one free), which directly increase UPT.
Recent apparel industry statistics reveal that seasonal trends and bundling strategies strongly influence UPT, driving consistent e-commerce growth
The electronics & gadgets sector has a lower average UPT, averaging approximately 1.4 units per transaction. High price points and the nature of purchases (often one high-value item like a smartphone or laptop) contribute to fewer items per cart. That being said, sales of complementary accessories like cases, chargers, and headphones help drive the UPT upwards. A 2025 industry analysis by eMarketer notes that retailers focusing on accessory bundles have seen a 20% increase in UPT compared to those selling standalone devices.
Beauty and personal care e-commerce experiences higher UPT, averaging around 3.5 units per transaction. This is due to customers frequently buying multiple items, such as skincare, makeup, and fragrances, in a single purchase. Research from NielsenIQ highlights that subscription models and curated kits encourage bulk buying, boosting UPT. Also, promotions like “bundle and save” deals have proven particularly effective in this category.
The Home & Kitchen category has seen a steady rise in UPT, now averaging 2.8 units per transaction. Consumers often purchase multiple related items, such as cookware sets, kitchen gadgets, or home décor pieces, together. Shopify’s 2025 e-commerce trends report emphasizes the role of product recommendations and bundle discounts in increasing UPT within this sector. The ability to upsell and cross-sell bundled products drives consistent growth in transaction volume.
Health and wellness products average about 2.0 units per transaction in 2025. Consumers typically buy a combination of supplements, fitness accessories, and wellness gadgets in one order. According to data from Grand View Research, the increasing popularity of holistic wellness products and monthly refill bundles is boosting UPT. The convenience of purchasing multiple items together also helps improve customer retention and transaction size.
Pet supplies show a UPT average of 3.2 units per transaction, reflecting multi-item purchases such as food, toys, and grooming products. Data from Packaged Facts reveals that pet owners frequently stock up during a single transaction to minimize repeat ordering. Subscription box models and loyalty programs further encourage larger cart sizes in this sector.
Subscription boxes are unique in that their UPT tends to be fixed based on the box contents, averaging 4 to 6 units per transaction, depending on the subscription type. According to McKinsey & Company’s 2025 retail report, subscription boxes are driving higher customer lifetime value by consistently delivering multi-item orders. These curated offerings promote customer satisfaction and increase the likelihood of upselling add-ons.
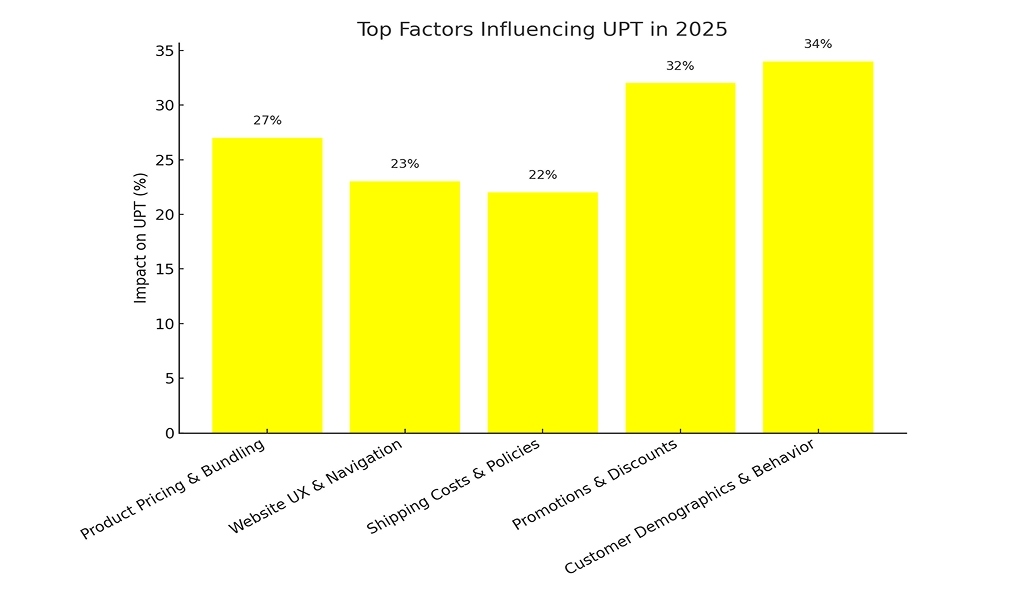
Having a clear idea of what drives Average Units Per Transaction (UPT) is essential for retailers looking to strategically grow revenue and optimize transaction value without increasing customer acquisition costs. Several internal and external variables impact how many products a shopper adds to their cart. These range from pricing strategy and website user experience to behavioral patterns and psychological triggers.
Through an analysis of these key influencers, brands can make data-driven adjustments to drive higher UPT and uncover new efficiencies. Below, we explore the five most influential factors based on current e-commerce studies and industry insights for 2025.
Exploring influencer marketing myths can reveal how misconceptions impact consumer behavior, helping retailers refine strategies to boost UPT and overall sales.
Pricing plays a central role in determining UPT. Research from McKinsey (2025) shows that dynamic pricing combined with bundling can increase UPT by up to 27% across consumer categories. When customers perceive greater value in buying more, they’re more likely to do so.
Bundles such as “Buy 2, Get 1 Free” or curated kits (popular in beauty, pet, and wellness sectors) boost UPT and improve perceived savings. Amazon, for example, reports 40% higher UPT for bundled offers versus standalone listings in its private-label household category. Smart bundling also helps reduce decision fatigue and increases average order size while also improving product discovery.
A smooth and intuitive shopping experience is crucial to encouraging multiple-item purchases. According to a 2024 Baymard Institute study, 70% of abandoned carts stem from poor usability or a complex checkout process. On the flip side, websites with optimized navigation, robust filtering, and an intelligent on-site search experience up to 23% higher UPT, according to data from Shopify Plus merchants.
Features such as persistent shopping carts, “add to wishlist” functions, and multi-item promotions displayed prominently during the shopping journey make it easier for users to explore and commit to more items.
For a deeper understanding of how user experience impacts search rankings and sales, explore our detailed Guide on the UX and SEO Connection
Shipping strategies directly affect consumer behavior and cart size. Data from Deloitte’s 2025 Retail Outlook shows that free shipping thresholds, especially when tied to quantity rather than value, can increase UPT by 15% to 22%. For instance, offering “free shipping on 3+ items” instead of a dollar value threshold often encourages customers to add more units rather than seek expensive single-item purchases.
Along with this, flexible return policies reduce purchase hesitation, especially in fashion and beauty categories where product trial and fit are significant concerns. The lower the perceived risk, the higher the likelihood of shoppers buying in bulk.
Discounts that reward volume are proven UPT drivers. Klaviyo’s 2025 Ecommerce Trends report indicates that multi-unit promotional campaigns such as tiered discounts (e.g., “10% off 2, 20% off 3+”) generate a 32% increase in UPT for mid-sized DTC brands. Limited-time deals and countdown timers further enhance urgency, encouraging shoppers to take advantage of bulk offers.
Importantly, personalized promotions based on purchase history or cart behavior (e.g., “complete your set” messages) convert at a higher rate and add incremental units to the transaction.
UPT also varies significantly by age group, lifestyle, and shopping intent. A report by GlobalWebIndex in 2025 finds that Millennials and Gen Z consumers are 34% more likely to buy multiple items per online transaction than Boomers due to greater comfort with digital discovery and FOMO-driven buying patterns.
Subscription buyers, repeat customers, and value-driven shoppers (often in household or pet supply categories) also show higher UPT. For example, Chewy’s subscription users average 4.1 items per order compared to 2.9 for one-time purchasers, largely due to replenishment patterns and loyalty incentives.
Want to know how brands personalize shopping journeys and boost multi-item purchases? Read our full guide on What Is Behavioral Targeting.
Once you understand the factors influencing Average Units Per Transaction (UPT), the next step is implementing targeted strategies to actively increase it. While each e-commerce vertical has unique dynamics, several proven tactics consistently drive higher UPT across industries. Backed by behavioral data and real-world application, the strategies below can help online retailers create larger, more profitable carts without relying solely on new customer acquisition.
Volume-based pricing is one of the most effective ways to encourage shoppers to add more items to their cart. According to a 2024 survey by Retail Dive, brands offering tiered discounts, such as “Buy 2, get 10% off” or “Buy 3, get 20% off”, report a 28% average increase in UPT. These discounts appeal to price-sensitive consumers while subtly upselling through perceived value, particularly effective in categories like beauty, pet supplies, and wellness.
Loyalty programs, apart from retaining customers, drive behavior. Data from Yotpo (2025) shows that customers enrolled in loyalty programs have a 19% higher UPT than non-members. Gamified elements like point multipliers for multi-item purchases or rewards unlocked at certain thresholds can encourage larger transactions. Sephora and Ulta have successfully used this approach to boost both loyalty and cart size.
Setting free shipping thresholds based on item quantity rather than price can be a game-changer. For example, offering “Free shipping when you buy 3+ items” not only promotes UPT but can also lower return rates, according to research by Shippo. Shopify Plus stores saw a 16–20% boost in UPT when switching from price-based to unit-based shipping incentives in 2024.
Strategically showcasing “frequently bought together” or “complete the look” bundles can increase UPT by up to 25%, per BigCommerce analytics. Leveraging AI-driven product pairings ensures relevance and boosts the chance of multiple product purchases in a single session.
Personalization tools powered by AI and purchase history significantly impact UPT. Nosto’s 2025 data reveals that personalized recommendations increase average cart size by 22%, as customers are more likely to trust and act on curated suggestions aligned with their interests and past behavior.
Effectively improving Average Units Per Transaction (UPT) begins with accurate tracking and insight-driven decision-making. Fortunately, modern e-commerce platforms offer a range of powerful tools to help analyze UPT, identify patterns, and uncover opportunities for growth. Below are five essential tools—both platform-native and third-party—that leading retailers use to monitor and optimize UPT.
Google Analytics 4 (GA4) is one of the most comprehensive tools for understanding customer behavior across the purchase journey. With customizable reports, GA4 enables you to track metrics like average items per transaction, product combinations, and funnel drop-offs. According to a 2025 Forrester study, businesses that actively use GA4 insights report a 21% improvement in UPT-related KPIs due to better targeting and segmentation. Enhanced eCommerce tracking allows retailers to measure what was bought and how product pages and CTAs influenced multi-item purchases.
For Shopify users, built-in analytics provide immediate access to UPT metrics. The “Average items per order” report is especially useful for tracking trends over time and analyzing performance across campaigns or product categories. Shopify Plus merchants who leverage advanced reporting features often see a 15–20% increase in UPT when using this data to refine bundling and upselling strategies. Integration with third-party apps further enhances Shopify’s value as a UPT optimization tool.
Discover more insights and growth trends in our complete guide on Shopify Statistics to optimize sales and customer experience.
BigCommerce offers granular reporting tools that break down product-level sales, customer behavior, and order composition. Its Enhanced Analytics Suite includes visual dashboards that allow merchants to identify UPT fluctuations by time of day, traffic source, or device. A 2025 internal survey revealed that 65% of BigCommerce merchants use UPT metrics to guide promotional planning and merchandising adjustments.
Learn how BigCommerce stacks up in features and performance in our detailed BigCommerce Vs Shopify comparison guide.
Email marketing platforms like Klaviyo and Mailchimp provide segmentation and personalization tools that can significantly influence UPT. By targeting customers with product-specific recommendations and quantity-based promotions, merchants using Klaviyo report up to 19% higher UPT from email-driven traffic alone, according to their 2025 usage report.
Heatmapping and behavior analytics tools like Hotjar or Microsoft Clarity help identify where users interact or drop off during a shopping session. These insights are critical for optimizing page layout, navigation, and product suggestions, all of which contribute to higher UPT.
Average Units Per Transaction (UPT) is more of a strategic level for growth than just a transactional metric. Understanding, benchmarking, and optimizing UPT help retailers unlock deeper insights, improve profitability, and create more value with every customer interaction.
A “good” UPT varies by industry. In 2025, averages range from 1.4 (Electronics) to 3.5 (Beauty & Personal Care). Subscription models may exceed 4.0. A good benchmark is to align with or exceed your category’s average while ensuring profitability and operational efficiency.
UPT should be measured weekly or monthly, depending on your store’s sales volume. Monitoring in real time during major campaigns or seasonal peaks (like Black Friday or product launches) is also recommended. Consistent tracking helps spot shifts in customer behavior and optimize promotional timing.
Not always. While higher UPT often increases revenue, profitability depends on margins and fulfillment costs. Selling more low-margin products may inflate UPT but reduce profits. Balance is key. Aim to increase UPT through strategic upselling and bundling of high-margin or complementary products.
Yes. UPT trends reveal buying patterns that improve demand planning. You can adjust reorder volumes if certain products are often bought together or in specific quantities. UPT insights also reduce overstocking and stockouts, especially in fast-moving categories like health, wellness, or fashion.
They’re closely related and often used interchangeably. Technically, UPT is an average across all transactions, while “items per order” might refer to a single customer’s cart or a session. UPT provides a broader business-level metric for benchmarking and trend analysis over time.

Table of Contents Introduction Search Engine Optimization (SEO) Blogging Social Media Try to

Table of Contents Introduction For creating brand awareness, explainer videos come in handy Give so

Table of Contents Introduction The power of Facebook video ad How to make your Facebook Video Ads w
Table of Contents Introduction Do’s Do consider native videos Do add a call to action Do

Table of Contents Introduction Exclusivity Piggybacking- Using Existing Users Let Users Sh

Table of Contents Introduction Build your personal brand to gain exposure Utilise content to build

Table of Contents Introduction Understanding the mobile-first index Metadata should be present on b
Table of Contents Introduction Create and optimise your GMB account Make your way to relevant onlin

Table of Contents Introduction 1) Release of Google Toolbar 2) Naming of Updates 3) Penalty for

Table of Contents Introduction 1. Utilise Guest Blogging Opportunities 2. Build Your Case Stu
SEO Revenue Generated
Leads Generated
For E-commerce Clients
Our biggest sale of the year! Redeem 25% OFF link building, brand mentions, and Digital PR. Limited Spots.
Offer valid only when you book a call.
Claim My Discount Now