What is the Average Time Spent on Social Media Each Day?
In 2025, people spend over 2 hours daily on social media, with teens logging the most time. Usage varies by age and region, raising concerns about mental health and digital wellness.
 Call Us
+1 857-847-3152
Call Us
+1 857-847-3152
Call Us
+1 857-847-3152
Call Us
+1 857-847-3152
In 2025, people spend over 2 hours daily on social media, with teens logging the most time. Usage varies by age and region, raising concerns about mental health and digital wellness.

Social media has become a foundational element of daily life, deeply integrated into how people communicate, consume information, and entertain themselves. In 2025, it’s no longer surprising to hear that the average user spends over two hours daily engaging with platforms like TikTok, Instagram, Facebook, and YouTube. However, what changed was the purpose and intensity of that time.
Social media touches nearly every aspect of modern interaction, whether for maintaining long-distance relationships, promoting businesses, following trends, or simply relaxing. The platforms we use, how long we use them, and the motivations behind that use vary greatly depending on age, region, lifestyle, and even occupation.
If we understand the way time on social media is distributed, we get important insights into societal behavior and can help inform healthier habits, tech policies, and media literacy education.

In early 2025, research from DataReportal and Global WebIndex confirms that the global average daily time spent on social media stands at approximately 2 hours and 21 minutes, or 141 minutes per day. That marks a subtle decrease from 143 minutes in 2024, signaling a modest dip but underlining that social media remains a deeply ingrained part of daily life. Meanwhile, Hootsuite and Talkwalker data affirm a roughly similar figure, at 2 hours 24 minutes per day.
What’s fascinating is that despite the addition of new platforms like Threads and Bluesky, average screen time hasn’t spiked. Instead, users spread their attention across more platforms, nearly seven monthly on average, but overall time moves slightly upward. This suggests users are fragmenting their digital attention rather than dramatically increasing screen time.
Such Social Media Statistics show that growth in the number of platforms doesn’t always lead to longer usage times. Instead, these Social Media Statistics reveal a redistribution of attention across multiple apps.
The dominance of short-form, video-driven platforms remains unchallenged. Aggregate North American and global data reveal TikTok leads with about 54 to 59 minutes per day, closely followed by YouTube at 49 to 60 minutes daily. TikTok’s average session length is reported to be around six minutes, making it one of the most addictive formats out there.
Behind these trailblazers are major global trends: Facebook users average around 31 to 32 minutes per day, Instagram about the same, and platforms like X (Twitter) and Snapchat come in at around 30–34 minutes daily. On messaging apps, WhatsApp users spend an estimated 34 minutes daily, suggesting that messaging, though not traditionally viewed as social media, forms a significant part of online engagement.
In essence, the platforms commanding the most time are those built around dynamic, visual content and messaging. These are the areas where users can consume, connect, and be entertained without delay.
Recent Facebook Engagement Rate figures indicate that while time spent may be lower than video-first apps, interaction levels remain strong within niche communities. Likewise, WhatsApp Statistics emphasize the platform’s role as a daily communication hub, with consistent usage across diverse age groups.
Geographical location significantly influences how people engage with social media. Factors such as internet infrastructure, smartphone penetration, cultural norms, and time availability all affect usage patterns. While some countries are characterized by high daily engagement, others reflect more balanced or limited use due to a lack of access or societal preferences.
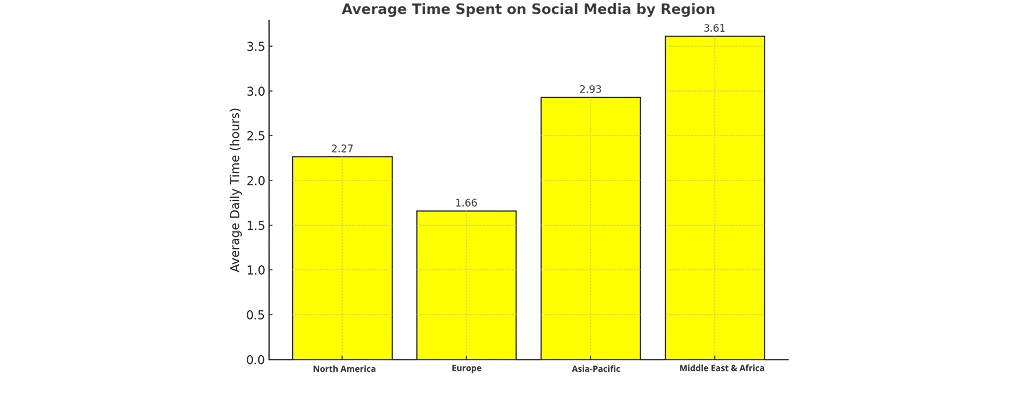
North America aligns closely with the global average: around 2 hours and 16 minutes daily. However, this figure masks generational variations; millennials and Gen Z typically exceed it, while older adults fall below it.
Europe fluctuates but generally mirrors this trend, with countries like the UK and Germany averaging 1 hour 46 minutes to 1 hour 33 minutes daily. These figures may be slightly conservative due to stricter digital regulations and social media skepticism in certain regions.
This region leads global engagement. For example, the Philippines averages an astonishing 4 hours and 14 minutes per day, which is, by far, the world’s highest. Indian users spend an average of 2 hours and 29 minutes daily, while China, despite heavy regulation, maintains around 2 hours and 4 minutes.
Although social media penetration in the Middle East & Africa remains relatively low (around 64% globally), active users in countries like Nigeria, South Africa, and Kenya spend an average of 3–3.5 hours daily. Nigeria clocks in at 3 hours 44 minutes, and South Africa and Kenya around 3 hours 32–34 minutes, reflecting vibrant local communities bound by messaging and video platforms.
One of the clearest differentiators in social media use is age. From teenagers hooked on TikTok to older adults scrolling Facebook occasionally, each age bracket exhibits distinct usage patterns, platform preferences, and online behaviors. Understanding these differences is critical for marketers, educators, and mental health professionals.
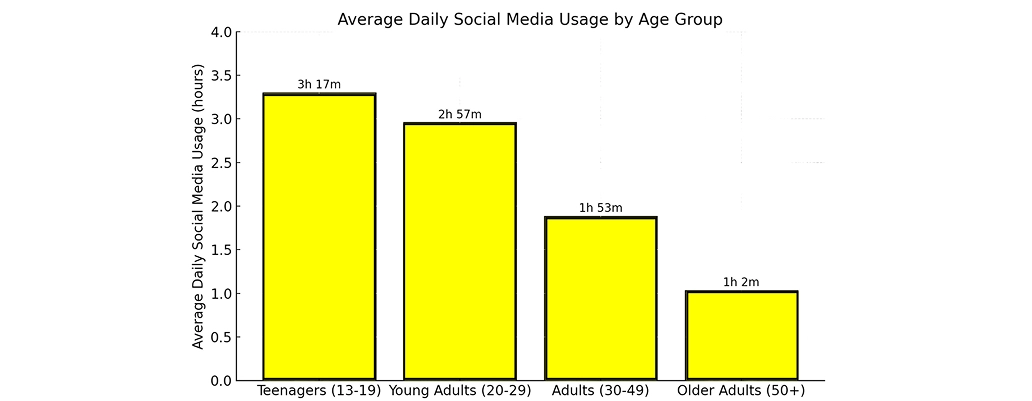
Teenagers represent the heaviest users of social media. Global studies cite Gen Z averages at 3 hours 18 minutes daily, U.S. teens stand at a staggering 4 hours 48 minutes, and teenage girls average 5 hours 18 minutes per day. This reflects immersive engagement with multi-platform content, especially short-form videos.
For young adults, global usage averages around 3 hours 8 minutes per day for those aged 18–24 and about 2 hours 47 minutes for 25–34-year-olds. Gender differences persist: women in this cohort usually spend a quarter of an hour more daily than men.
Usage falls flat in core adult years, with 35–44-year-olds spending about 2 hours 12 minutes and 45–54-year-olds spending around 1 hour 34 minutes daily. Even as adoption remains strong, time spent is tailored more toward utility, such as networking, news, or niche interests.
Social media use declines significantly later in life. Adults aged 55–64 average 1 hour 2 minutes, while those 65 and older fall to around 31 minutes daily. Yet, new data suggests social media is becoming more entrenched among seniors, with older women slightly increasing their usage in recent years.
Looking at these patterns highlights the pros and cons of social media engagement across age groups — while younger audiences enjoy richer entertainment and connection, older users often prioritize meaningful interaction and utility.
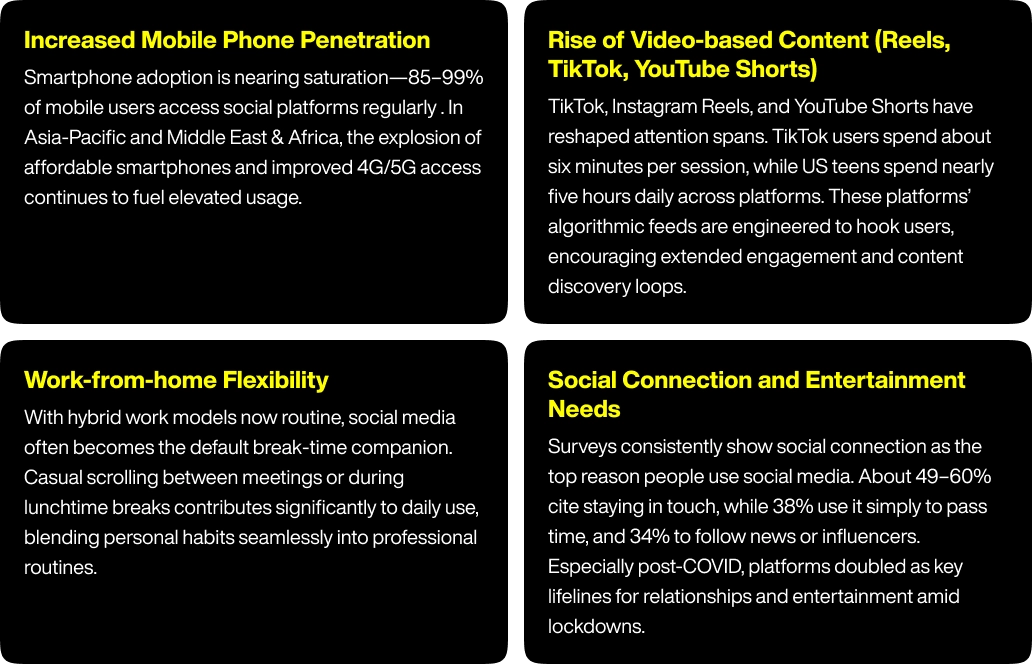
Several socio-technological forces have significantly influenced the way we use social media in 2025. These factors not only affect the volume of time spent online but also the type of content consumed and the motivations behind that consumption.
While social media can offer community, creativity, and joy, its overuse presents significant mental health risks. Studies consistently link excessive social media use with increased anxiety, depression, sleep disruption, and low self-esteem, particularly among teens and young adults.
Neurological studies show that platforms are designed to affect the brain’s reward systems through dopamine-triggering interactions like likes, shares, and endless scrolling. Over time, this leads to reduced attention spans, impulsivity, and digital dependency. The “TikTok brain” concept—coined by pediatric experts—underlines cognitive fatigue and mood instability resulting from prolonged video consumption.
Moreover, curated content can lead to unhealthy social comparison, FOMO, and cyberbullying, intensifying emotional distress. In some countries, like Australia, governments have already proposed or enacted laws to ban social media access for children under 16, citing mental health data.

Excessive usage is undeniably linked to negative outcomes. Studies show teens logging 3+ hours daily report lower life satisfaction and increased anxiety and depression. The impact is widely recognized: in Australia, interestingly, teens using social media 1–3 hours daily fare better mentally than both low and high users.
Curated feeds and passive consumption exacerbate stress and self-comparison. Research from UBC suggests that how we engage, more than how long, drives mental health outcomes, with reflective and mindful scrolling and interactions significantly mitigating negative effects.
Evidence suggests problematic use among adolescents correlates strongly with risks like self-harm, eating disorders, attention deficits, and bullying. Such findings have prompted legislative and industry responses, including bans on under-16 use in Australia and proposed “Kids Off Social Media Act” protections in the U.S.
Fortunately, there’s rising awareness among younger generations. Over 86% of Gen Z report reducing use, and 67% acknowledge negative mental impacts, with 26% attempting a digital detox. The platforms, as such, are also moving toward more mindful design, emphasizing active interaction over passive consumption.
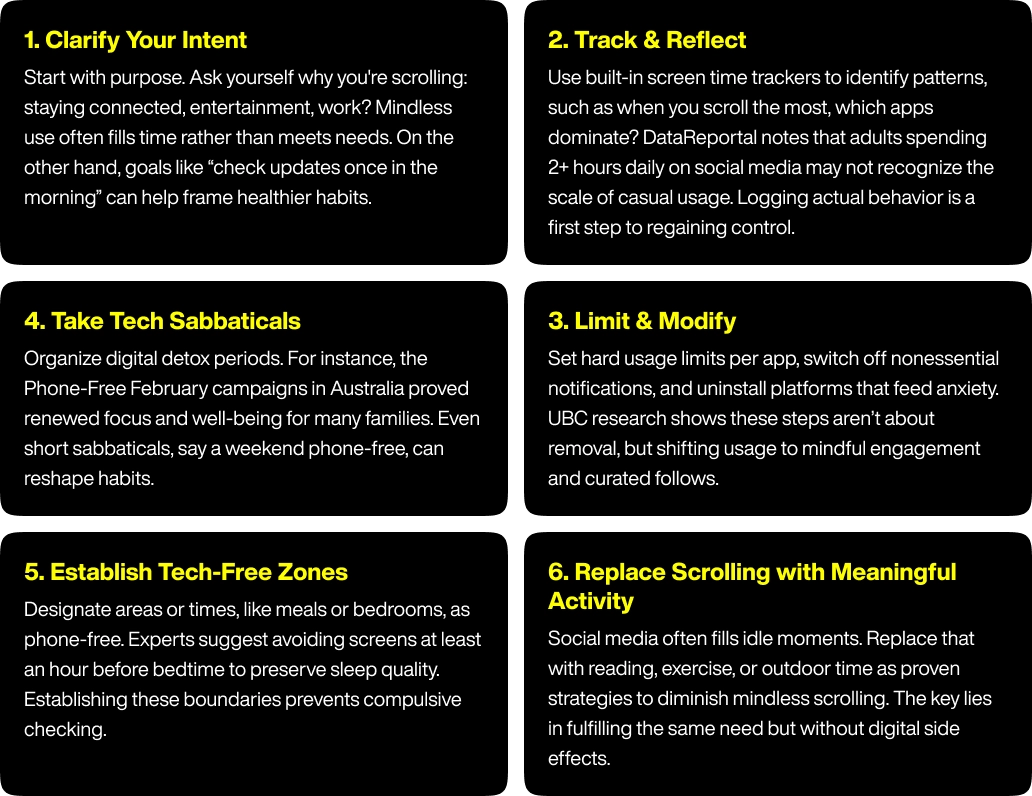
There are ways to manage social media time better and more mindfully. Here are some of these:
To sum things up, in 2025, social media remains central to global life, with users averaging between 2 hours 21 minutes and 2 hours 24 minutes daily, and Gen Z teenagers consuming up to 5 hours daily. Regional usage peaks in the Philippines and Latin America, while Asia-Pacific, North America, and Europe hover near the global average. Video-based platforms like TikTok and YouTube continue to dominate user attention.
But the conversation has shifted, and well beyond “likes” and “views.” Mental health effects and addiction risks are center stage. When used mindfully, reflectively, purposefully, and in moderation, social media can enrich connection, information access, and entertainment. It can impair well-being when it becomes reflexive or passive, especially among teens.
Individuals can tip the balance toward healthier digital lives by setting clear intentions, taking control of notifications, defining tech-free zones, and adopting mindful engagement strategies. The emerging culture of sober usage, wellness sabbaticals, and informed policy debates reflects this collective shift.
Globally, approximately 2 hours 21 minutes per day, with a slight dip from 2024’s 143 minutes.
TikTok leads at around 54–59 minutes/day, followed closely by YouTube (49–60 minutes/day). Facebook and Instagram average 32 minutes, with X and Snapchat around 30–34 minutes.
Yes. Gen Z users average 3 hours 18 minutes, while U.S. teens (13–19) often spend 4 hours 48 minutes daily, versus 18–24-year-olds at 3 hours, and older adults well under 2 hours.
Greatly. Users in the Philippines, Nigeria, and Brazil spend 3.5–4+ hours/day, whereas in Japan and Germany it’s under 1 hour 40 minutes, and the U.S. sits around 2 hours 16 minutes.
Define usage goals, track patterns, mute notifications, uninstall distracting apps, enforce tech-free zones and sabbaticals, and replace scrolling with meaningful offline activities.
Factors include widespread smartphone use, hybrid work-life integration, gritty engagement via video content, curated algorithmic experiences, and human needs for connection and leisure.

Table of Contents Introduction Search Engine Optimization (SEO) Blogging Social Media Try to

Table of Contents Introduction For creating brand awareness, explainer videos come in handy Give so

Table of Contents Introduction The power of Facebook video ad How to make your Facebook Video Ads w

Table of Contents Introduction Do’s Do consider native videos Do add a call to action Do

Table of Contents Introduction Exclusivity Piggybacking- Using Existing Users Let Users Sh

Table of Contents Introduction Build your personal brand to gain exposure Utilise content to build

Table of Contents Introduction Understanding the mobile-first index Metadata should be present on b

Table of Contents Introduction Create and optimise your GMB account Make your way to relevant onlin

Table of Contents Introduction 1) Release of Google Toolbar 2) Naming of Updates 3) Penalty for

Table of Contents Introduction 1. Utilise Guest Blogging Opportunities 2. Build Your Case Stu
SEO Revenue Generated
Leads Generated
For E-commerce Clients